This tutorial explains how to use the Microsoft Visual Studio Debugger to debug 32-bit assembly language programs running in protected mode. Specifically, you will learn how to perform the following tasks:
- Step through your program, viewing the source code
- Set breakpoints in your code
- View CPU registers and flags
- View a disassembly of your program
- Watch the values of program variables
- View the runtime stack
- Display blocks of memory
For additional information about debugging in Visual Studio, visit http://msdn.microsoft.com and search for Debugging in Visual Studio.
Select this link if you're having trouble getting the debugger to recognize debugging information.
Configure Visual Studio for Debugging
Visual Studio has a set of different configurations that make it easy to create a variety of project types (Visual Basic, ASP.NET, etc.). In order to get the most out of debugging assembly language programs, you need to select an appropriate configuration. From the Tools menu in Visual Studio, select Import and Export Settings. (In Visual Studio Express, select Settings from the Tools menu, then select Import and Export Settings.)
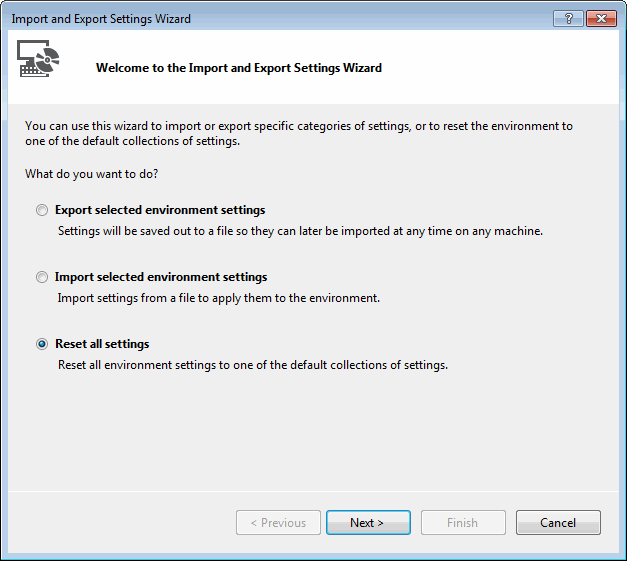
In the following dialog, select Reset all settings and click the Next button.
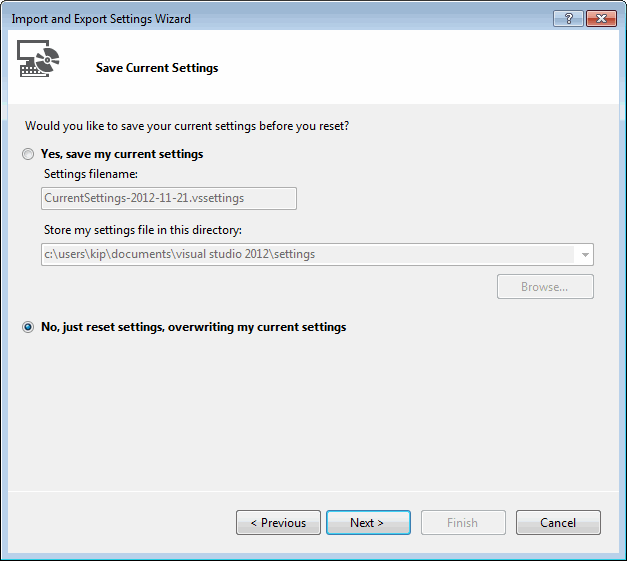
In the next pane, you have the option of saving your current settings. This would be useful if you want to return to your current settings later. Select an option and click the Next button.
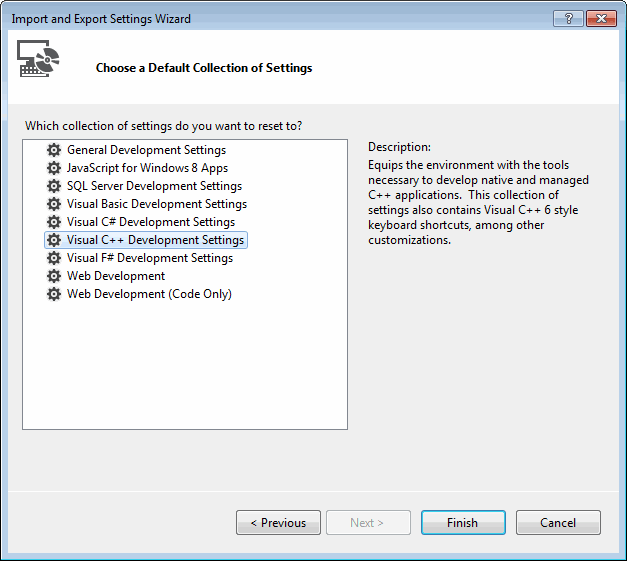
In the following pane (from Visual Studio Professional), select the Visual C++ settings and click the Finish button.
Once your settings have been reset, click the Close button to close the wizard.
Once you begin working with the debugger, you can fine-tune the arrangement of the Visual Studio menus and windows, and save your specific settings for later recall.
Open a Visual Studio Project file
In this step-by-step tutorial, you will open the sample project and insert an example program named AddTwo.asm.
- Go to the Examples\Project32 folder in the disk directory that contains the book's sample programs. Ordinarily, the full path will be c:\Irvine\Examples\Project32.
- Double-click the file named Project.sln.
- In The Solution Explorer window, right-click any existing files with an extension of .asm and select Remove. When prompted by a dialog window, click the Remove button.
- Right-click Project in the same window, select Add, and select Existing Item.
- Browse back one level to the Examples folder, then forward to the \ch03 folder, and select the file named AddTwo.asm. It will be added to the Solution Explorer window.
- Select Save All from the File menu to save your project settings.
- Double-click the AddTwo.asm filename in Solution Explorer to open it in the editor:
; AddTwo.asm - adds two 32-bit integers.
; Chapter 3 example

.386
.model flat,stdcall
.stack 4096
ExitProcess proto,dwExitCode:dword

.code
main proc
	mov	eax,5
	add	eax,6

	invoke ExitProcess,0
main endp
end main
Build the project by selecting Build Solution from the Build menu. In the output window, you should see text similar to that shown below. Extra lines may be added:
1>_MASM:
1> Assembling [Inputs]...
1>Link:
1> Project.vcxproj -> C:\Irvine\Examples\Project32\Debug\Project.exe
1>Build succeeded.
1>
1>Time Elapsed 00:00:04.38
========== Build: 1 succeeded, 0 failed, 0 up-to-date, 0 skipped ==========
The important thing to notice is the last line, which indicates that the build operation succeeded.
Start the Debugger
Press the F10 key to start the debugger. Your environment should appear like this: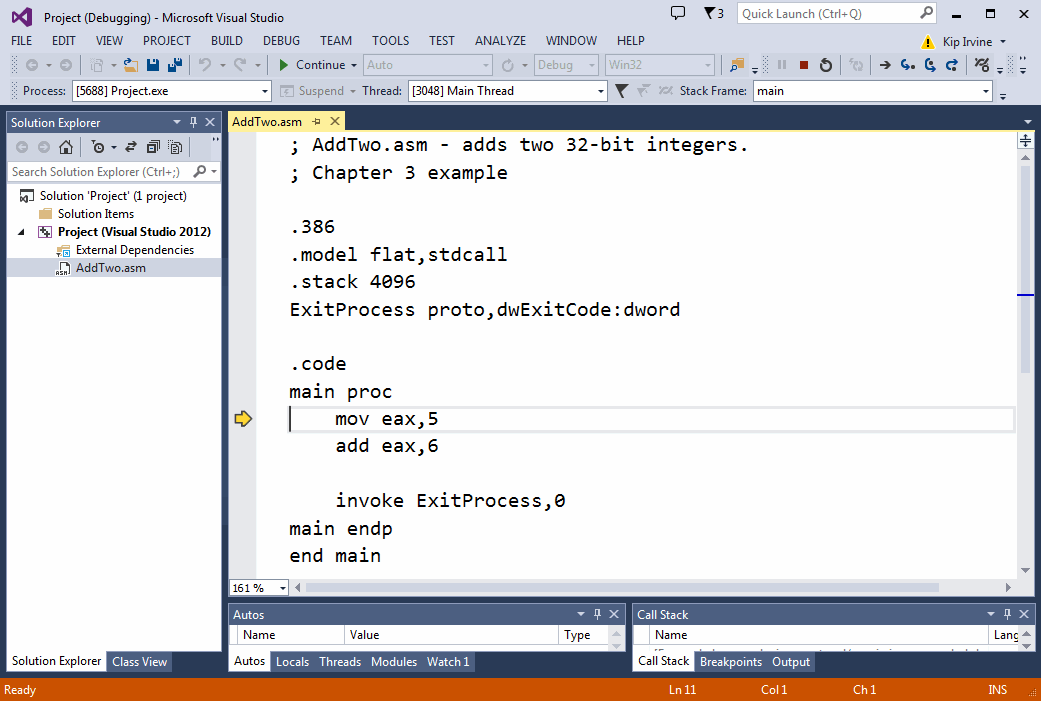
Don't worry if some of the windows shown here do not appear on your screen. You can open and close them at will. First however, let's take a tour:
Source Window
The Source window displays the program's source file. Note that the first MOV statement has a yellow arrow next to it. The arrow always indicates the next statement that's about to execute.
| Tip: You can remove any debugger window by right-clicking on its Tab and selecting Hide. You can open any debugging window by selecting Windows from the Debug menu. You can make a window collapse when it is not used by clicking the Auto Hide icon in its title bar. The icon looks like a push pin. If the pin points sideways, the window will collapse automatically. |
Adjust the Debugging Support Windows
This is a good time to remove panels that you will not use. In the lower part of the debugger window, select an remove all but the Watch and Output panels. On the side panel, remove all but the Solution Explorer window. Also, from the Debug menu, select Windows, and select Registers. You may want to remove some of the extra toolbars from the top of the window. If so, select Toolbars from the View menu, and un-check any toolbars you want to remove. You can also remove individual buttons from a toolbar: Select the dropdown arrow on the right side of the toolbar, and select Add or Remove Buttons.Moving and Undocking Windows
You can move any window by dragging its titlebar with the mouse. You can dock it (position it) by dropping it on any side of your workspace. For example, I like to put the Registers and Watch windows on the right side of the work area. If, however, you have more than one window positioned directly on top of each other, dragging the title bar will move all windows at once. If you want to select only one window from a cluster of windows, drag its tab (on the bottom) to the new location. The other windows in the cluster will not be affected. You can undock a window by dragging it with the mouse to any location on your desktop. It can be completely outside the Visual Studio window.Watch Window
For this part of the tutorial, you will need two download the AddSub2.asm program by right-clicking this link. After downloading the file, please add it to your Solution Explorer window, and remove the AddTwo.asm program. Here is a partial program listing:INCLUDE Irvine32.inc .data val1 dword 10000h val2 dword 40000h val3 dword 20000h finalVal dword ? .code main PROC mov eax,val1 ; start with 10000h add eax,val2 ; add 40000h sub eax,val3 ; subtract 20000h mov finalVal,eax ; store the result (30000h) call DumpRegs ; display the registers exit main ENDP END mainIf at some later time the watch window disappears, you can get it back again. While currently debugging a program, select Windows from the Debug menu, and select Watch 1. A Watch window is like an electronic spreadsheet that displays the names and values of selected variables. As you step through a program, you can see variables in this window change value. Currently the window is empty, but you can drag any program variable into the window with your mouse.
Next, you will display the value of some variables in the Watch window. Drag the val1, val2, val3, and finalVal variables into the Watch window and note their current values:
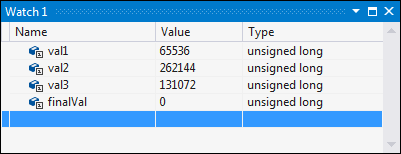
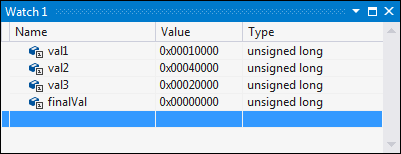
The values are currently displayed in decimal, so select hexadecimal format by right-clicking on the watch window and selecting Hexadecimal Display from the popup menu. Following is a sample:
Memory Window
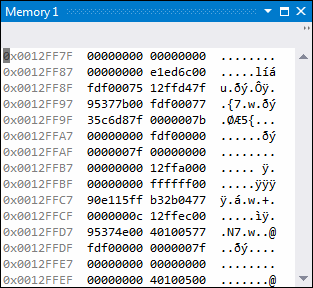
From the Debug menu, welect Windows, select Memory, and select Memory 1. The Memory1 window displays a raw dump of memory in either hexadecimal or decimal. It is particularly useful when working with array variables. Since we don't have any arrays in the program, let's display the value of val3. Next to the Address label, type: &val3
The & before the variable name means to interpret the variable name as an address. In assembly language, all labels are implied addresses. Variable names are case-sensitive in the debugger. The Memory window displays a series of individual memory bytes, beginning at the address of val3. Right-click on the window, and select 4-byte Integer as the display format. Along the left side of the window is shown the address of the first value in each line:
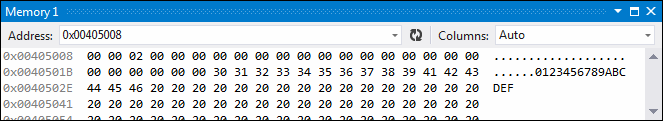
In our sample, val3 is located at address 00405008, although your addresses might be different. You can also type a hexadecmal constant into the Address field. Use the C-language format, where the digits are preceded by "0x". For example: 0x0040400C.
Note: The memory Windows are only available if address-level debugging is enabled in the Tools / Options / Debugging settings, available by clicking on the Tools menu in Visual Studio, and then selecting Options.
Register Window
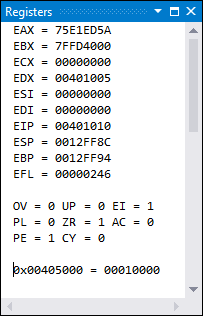
You can display the Register window by selecting Windows from the Debug menu, and selecting Register. The Register window displays the contents of the CPU registers. The flag values do not show by default, but you can add them in by right-clicking and selecting Flags:
 |
Key to flag abbreviations
|
Disassembly Window
Select Windows from the Debug menu, and select Disassembly. The Disassembly window displays a raw listing of the program's code. In some programs, it will show code generated by macros or by high-level MASM directives (such as .IF, in Chapter 6).
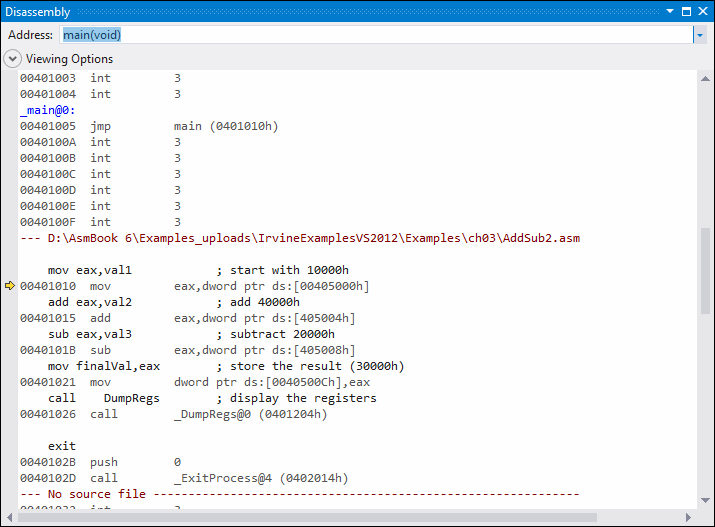
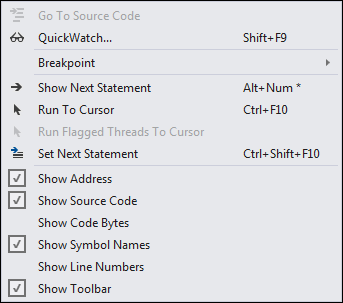
If you right-click inside the Disassembly window, the popup context menu offers different viewing options:
Here is a sample in which Show Source Code is disabled, and both Show address and Show symbol names options are enabled:
--- AddSub2.asm ----------------------------------------------------------------
main:
00401010  mov         eax,dword ptr [val1 (405000h)]
00401015  add         eax,dword ptr [val2 (405004h)]
0040101B  sub         eax,dword ptr [val3 (405008h)]
00401021  mov         dword ptr [finalVal (40500Ch)],eax
00401026  call        DumpRegs (4011F5h)
0040102B  push        0
0040102D  call        ExitProcess (401D30h)
The offset of each variable apears next to its name. The exit statement in the source code listing has been translated into a call to the MS-Windows ExitProcess function, which terminates the current program.
Steping Through the Program's Execution
Next, you will begin stepping through the program's execution, one line at a time. Press the F10 several times and watch the yellow arrow in the Source window move from statement to statement. Notice the following as you step through the program:
- Individual register names (in the Register window) turn red, indicating that they have been modified. The AddSub2 program modifies the EAX and EIP registers quite a bit, as you can see.
- Variables in the Watch window turn red when they are modified.
- Memory locations in the Memory window turn red when they are modified.
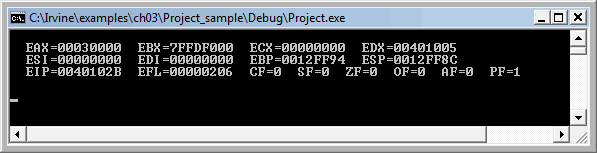
As soon as you step past the call DumpRegs statement, click on the black MS-DOS icon on the Taskbar at the bottom of the screen. You should see the program's output, which is a register display:
When you reach the exit statement and press F10, the debugger halts and you return to editing mode.
Step Into Command (F11)
Another way to step through a program is to use the Step Into (F11) command. It steps down into procedure calls. In contrast, the F10 key just executes procedure calls without tracing into the procedure code.
Stopping and Restarting
It's easy to either stop or restart your program inside the debugger while you're in the process of stepping through a program:
- To restart the program, select Restart from the Debug menu. The program is reloaded into memory, so any changes previously made to variables in the Watch window are undone. Also, you have to retype the name of your variable in the Memory window, because it resets itself to a default address.
- To stop debugging in the middle of a program, select Stop Debugging from the Debug menu. You can also use the icon containing a small square on the Debug toolbar.
Toggle Breakpoint (F9)
You can set a breakpoint on any executable line in your source program by either clicking the mouse in the left margin, or pressing the F9 key. This can be done before you start the debugger, or while you are stepping through the program. If you press F9 when the cursor is on a line containing a breakpoint, the breakpoint is removed. The following image shows code containing a breakpoint: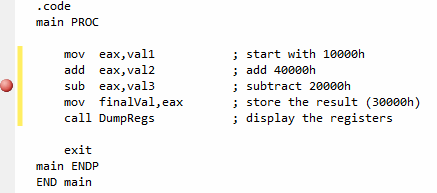
When you set a breakpoint, you can run your program at full speed up to the line containing the first breakpoint. The debugger will pause on the line, and wait for you to either step through the code from that point, or run the program to the next breakpoint.
- Use the F5 key (Menu: Debug / Run) to start a program and run to the first breakpoint.
- When at a breakpoint, use the F5 key (Menu: Debug/Continue) to continue execution to the next breakpoint.
| Tip: Be sure to stop the debugger before trying to modify and re-assemble your program's source code. Otherwise, the linker will refuse to assemble your EXE file, indicating that it's currently in use |
Viewing the Runtime Stack
The runtime stack will become more important as you beginn to write programs that contain procedures other than main. Each time you call a procedure, you place the program's return address on the stack. (This is explained in Chapter 5.) To view the runtime stack while debugging, display a memory window at the address specified in the ESP register. In the following image, the stack shows a return address (00401025) stored at the memory location point to by the ESP (stack pointer) register:
When you display the stack, right-click the memory window and select 4-byte Integer as the display format.
Saving Your Visual Studio Setup
After configuring Visual Studio to your debugging and editing preferences, you would be wise to save your setup. Here are the steps:
- From the Tools menu, select Import and Export Settings.
- In the next wizard step, select Export selected environment settings.
- In the next step, you select which settings to save. Leave the default selections unchanged.
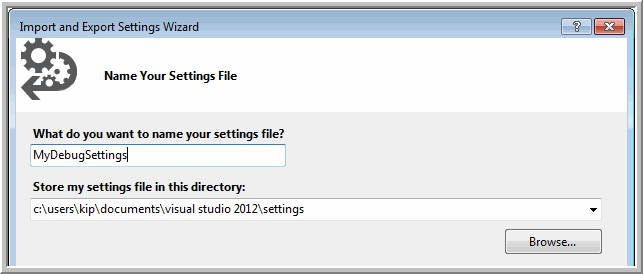
- In the last panel, select a name that you're likely to remember for the settings file and click the Finish button. Here is a sample of this step (change 2012 to 2013 in your copy):
If you ever want to return Visual Studio to the settings you've saved, just run the Import and Export Settings Wizard again.